
[SARK-100 Pc Scan] SWR Analyzer Software
Now a days small VNA’s are available at a reasonable cost. Older instruments like the SARK-100 and its other brother and sisters lack of the possibilities of a VNA. However, with this new software I hope many SARK-100 users can still get useful data from these devices.
It is the 2e update since 2018, when I got my first VNA, and did not really have any use for the “old antenna analyzer”. But I have realized that many people, (probably radio hams) still visit my site and look for the software to read data. This was the trigger to make a software that will blow the heck out of this now old instrument. Well there are limitations in the communication that will slow down everything compared to the simulation mode.
The updating speed is highly depended on the baud rate and the scan resolution. Ex. 20m 14 to 14.350MHz with 0.01MHz step.
What takes time is not the calculations but that it is sent out 350 commands over serial port/USB (one for each point). Each measurement must go instrument → PC → graph, and each communication takes maybe 10-15 ms. 350 × 15 ms ≈ 5s. 0.05 step will take about 1s.
All calculations are made within the software, no external Excel sheet is used.
Owen (VK1OD) has written a blog about this program. http://owenduffy.net/blog/?p=10536 That was many years ago and has really nothing to do with this program.
The SARK-100 is a SWR analyzer and the range is from 160M to 6M. The Mini-60 and MR-100 also works with this software.
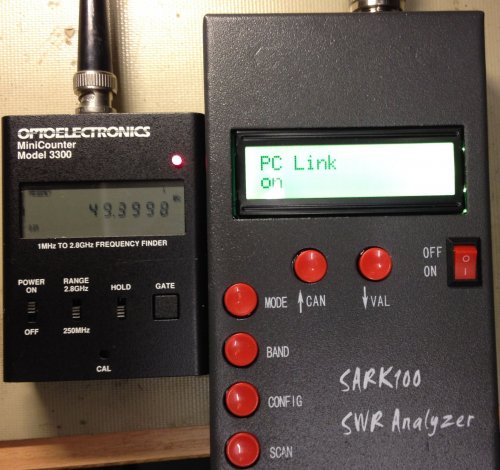
One nice feature is the PC interface which makes it possible to do some automation.
I have made a program that communicate with the SARK-100 and plot the data both as a graph and in a smith chart. The data can also be stored as an CSV file.
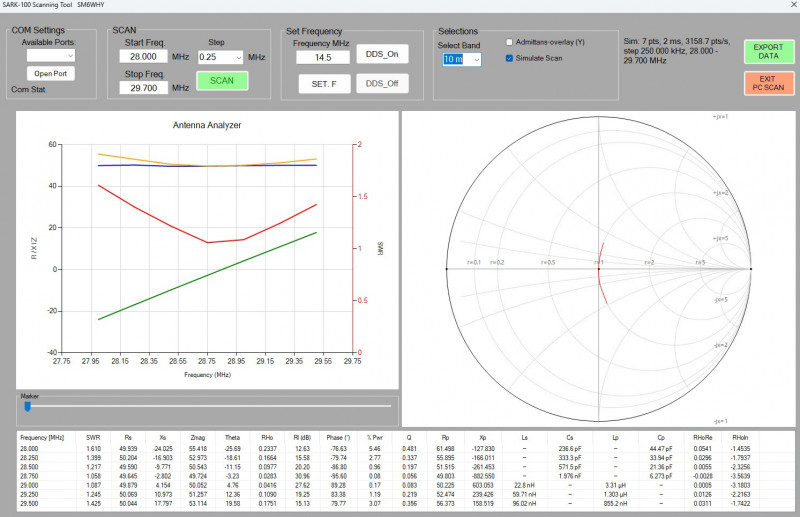
If you mouse hover over the top of the collected data an explanation will be seen, e.g., SWR, RX XS etc. The check admittance also has a tool tip which shows a short description what happens if it is checked. In the manual more info can be found.
And here is the SARK-100 original manual:
Remember that you also need the USB driver and the .NET Framework installed. There is no installation file in this version just unzip the file and then start the program with the exe file.
Drivers
http://www.ftdichip.com/Drivers/VCP.htm
http://www.microsoft.com/en-us/download/details.aspx?id=42643
The Chinese clones sometimes change the serial chip. If you cant get contact between the Pc and Sark-100/Mini-60 you can try these drivers.
New update! Jan-2026
New updated SW. Some improvements done. Realized that the chart update is not really fast, du to limitations in the communication. However, better than before. Now Ver-6 is latest.
📡 Why the Smith Chart Behaves Correctly Now
A Smith chart shows how the complex impedance of an antenna changes with frequency. For it to behave correctly, three conditions must be met:
- Frequency Must Increase in the Same Direction as Rotation
When frequency increases, an antenna’s impedance typically traces a curve on the Smith chart that rotates:
➡ Clockwise if the antenna is inductive at the low end ➡ Counter-clockwise if capacitive at the low end
Previously, the sweep data was processed in reverse order, so the trace rotated backwards. Now the sweep is fed in ascending frequency, like on a real VNA.
- Reflection Coefficient (Γ) Must Have the Correct Sign Convention
The Smith chart plots the complex reflection coefficient:
Γ=Z−Z0Z+Z0\Gamma = \frac{Z - Z_0}{Z + Z_0}Γ=Z+Z0Z−Z0
This is critical because:
✔ The real part determines how far left/right the point sits
✔ The imaginary part determines inductive (+j) or capacitive (-j) reactance
✔ The angle of Γ determines direction of rotation
Earlier, Γ sometimes got sign-flipped or computed indirectly from SWR, causing mirrored paths. Now it uses R and X directly, which is how proper VNAs operate.
- Same Sweep Index = Same Point Across Displays
Before the fix:
- SWR marker pointed at one frequency
- Smith marker pointed at another
- Table values were for a third
This makes interpretation impossible.
Now the SWR plot, Smith chart, and data table all reference the same sweep point, so:
✔ Clicking the marker gives the same frequency
✔ SWR=1 shows near the center
✔ Resonance lines up everywhere
- SWR ≠ Center of the Smith Chart
A common assumption is that SWR=1 means the marker sits at the center. But that’s only true if:
Z=Z0Z = Z_0Z=Z0
In practice:
- Many antennas resonate at SWR≈1 even when R≠50ΩR \ne 50ΩR=50Ω
- Smith chart shows impedance, not SWR
So now the software correctly shows for example:
- Resonance (X=0)
- With R≠50ΩR \neq 50ΩR=50Ω
- SWR slightly above 1
- Marker not at center
Just like on a NanoVNA or RigExpert.
- No Artificial Interpolation Looping
Earlier attempts tried to force “smoothness” by interpolating additional points. This can make the curve loop backwards, especially near resonance.
Now it plots the actual measured points, so the Smith trace agrees with reality.
The binary is not digitally code-signed. This is normal for open-source / amateur radio software and causes SmartScreen / AV heuristics to flag the download as “unknown” or “potentially unsafe”.
There is no malicious code — the false positive is due to:
• unsigned executable
• low distribution volume
• serial-port access
• no prior reputation score
If you have bookmark this page do a reload of the page occasionally to be sure it is the latest version.
If you like the program and feel to donate use the Donate button.
>
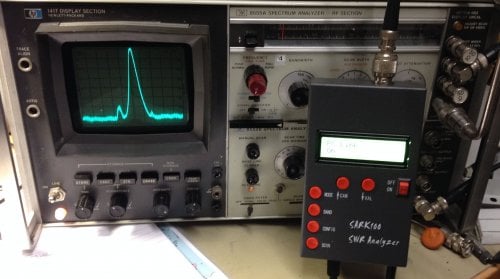
Frequency test of the SARK-100 (Chinese model)
Let's see if the analyzer keep it's manufacturer's promise?
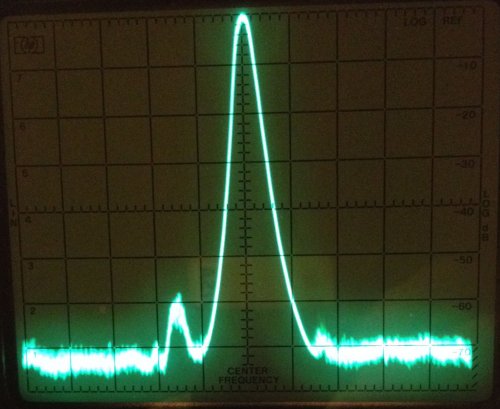
Spectral Purity: Harmonics down >- TBD dB beyond 60 MHz
Here is a 50MHz signal generated from the SARK-100.
And the spectral purity looks to be ok, -60db.
A simple frequency test was also performed.
If you would like to see more projects please goto: https://sm6why.n.nu/
Welcome
Welcome to sm6why.n.nu.

My Newsletter
Links