NF measurement using a Spectrum Analyzer
First, this program is just a calculator with the functionality to save the measured data to an Excel sheet.
Noise figure measurement can be done in different ways with different result. If a spectrum analyser is available, it can be done using the gain or Y method. The simplest way is the gain method. And is the method that can generate most uncertainties. It relies on how accurate the gain of a device can be measured. High gain devices (LNA) can be quite accurate measured using this method. SA averaging is also important.
I have only done simple NF measuring, and do not use external pre-amp and do not take account for the SA’s own internal noise or the SA’s input return loss. All these uncertainties will add on, but the measured result can be compared to the manufacturer measured NF of LNA’s and see how close it is. When this is known measuring on home built LNA’s can be fun to compare.
If your SA can display dBm/Hz the noise figure, NF of the device under test can then be computed as: NF = Noise + 174 dBm/Hz – Gain
Why 174dBm/Hz?
The average temperature of the earth's surface is approximately 62.3°F, 16.8°C, or 290°K and provides the energy to the surrounding matter that generates natural background noise. The thermal noise generated due to this temperature equals -174 dBm/Hz or a few nanovolts. So, during normal indoor temperature -174 can be used. At least for us normal amateurs.
If your SA cannot display dBm/Hz the thermal noise must be re-calculated with respect to the SA’s RBW. Example, 1Hz is equal to -174, 10kHz is -134 dBm/Hz. This is selectable in the calculator.
If you are lucky to have a calibrated noise source the Y-method is of course the choice. This is a more accurate method.
Turning the noise source OFF/ON and calculate the Y-factor and use the calibrated ENR value generates the NF. Here is how good and well calibrated noise source you have and also the SA averaging the key for accuracy.
By ticking the checkboxes different parameters will be added to the list view. You probably want to test the gain and NF for different frequencies. Then save the result.
I noticed that the program needs to have dot and not comma as delimiter settings in Windows. This can be set in the regional settings=> additional settings.
A screenshot from the program. Download: nf-sa-calculator.zip

The exported Excel file is saved in: C:\Test-Reports\Noise Figure
No fancy report is made, just the collected data.
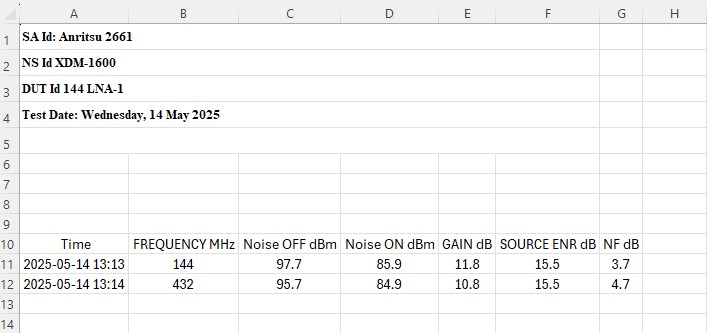
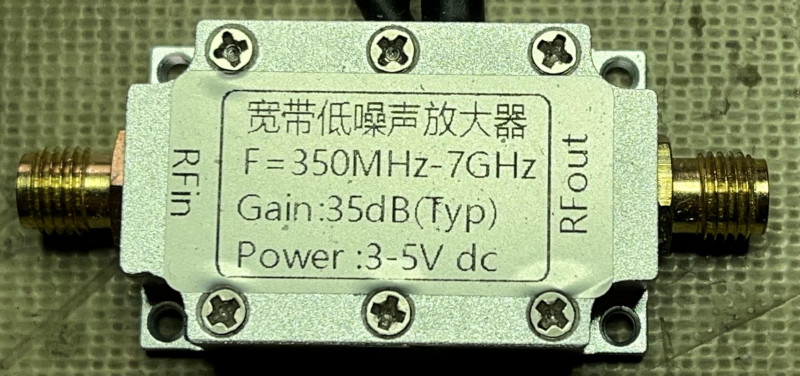
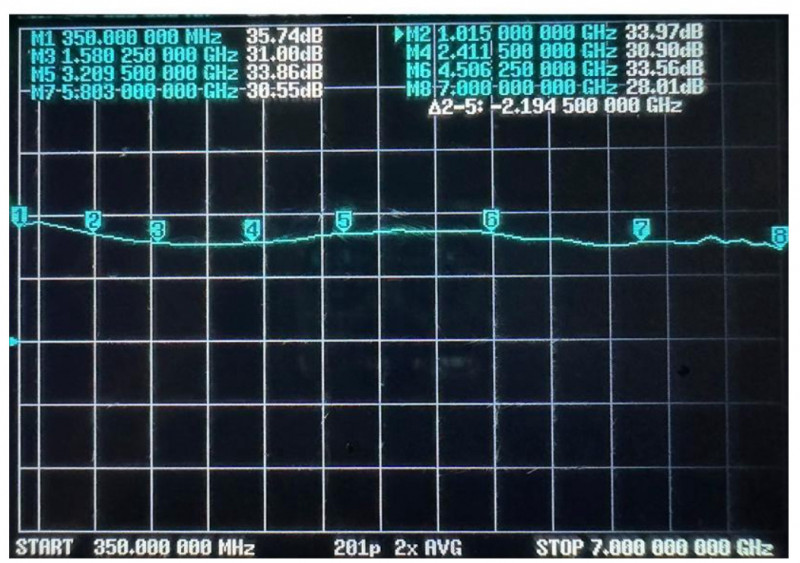
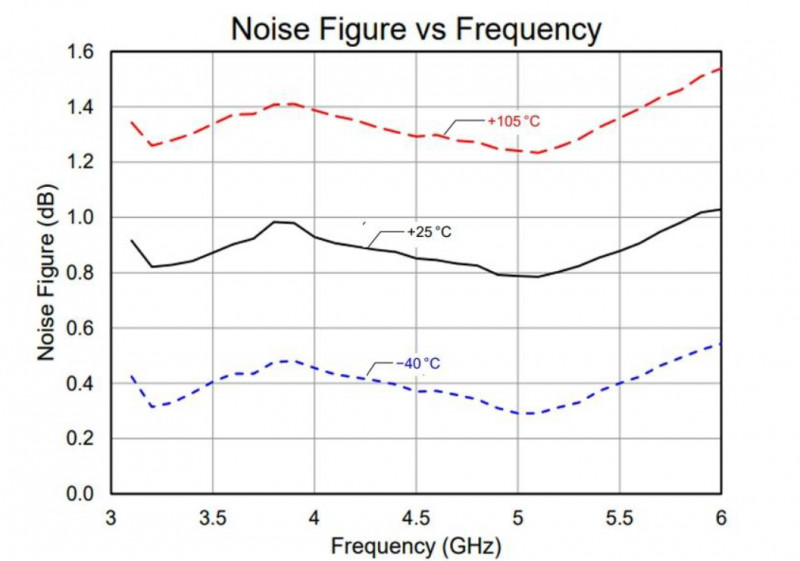
A Chinese LNA that can be found on the net. The manufacture gain data @ 350MHz is about 35dB. However, there are no data of the noise figure below 3GHz.
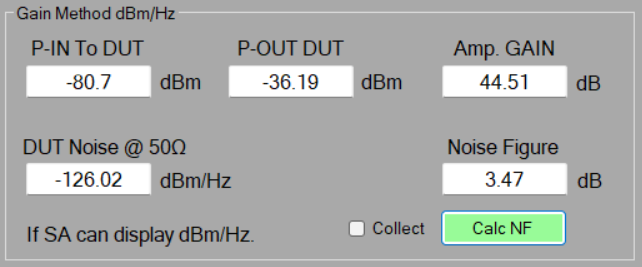
I tested to measure the NF @ 432MHz using the gain method. Lot of uncertainties are included in this measurement.
The gain measurement should be quite accurate using the SA. This measurement shows a gain of 44.5dB. About 10dB more gain than the specification.
I compared the SA gain measurement with my Gigatronics 8541 power meter, and the result is 44.94dB gain. 0.5dB difference is what I would say acceptable. I have no idea what the real NF is @ 432MHz for this LNA however, the gain method say’s about 3.5dB. If I adjust the gain to the power meter values the NF becomes 3dB.
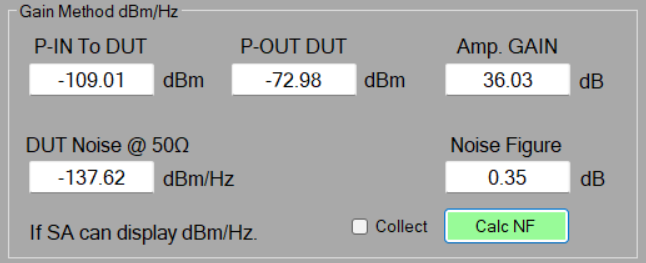
Let’s try to measure @3GHz. From the manufacturer graph it can be estimated to be a NF of 0.8 to 1dB. To optimize the measurement the SA RBW is set to 1kHz and the VBW to 10Hz. The scan will be very slow; however, the SA noise floor is low. The DUT noise floor is now @ -137.62 dBm/Hz at 3GHz.
Optimizing the measurement to the SA benefit gives us a NF of 0.35 using the gain method. Probably a to low result. But not totally off from the manufacturer data. Yes, 0.5dB is a lot when talking about NF, but I think that 0.5 accuracy for the gain method is quite good.
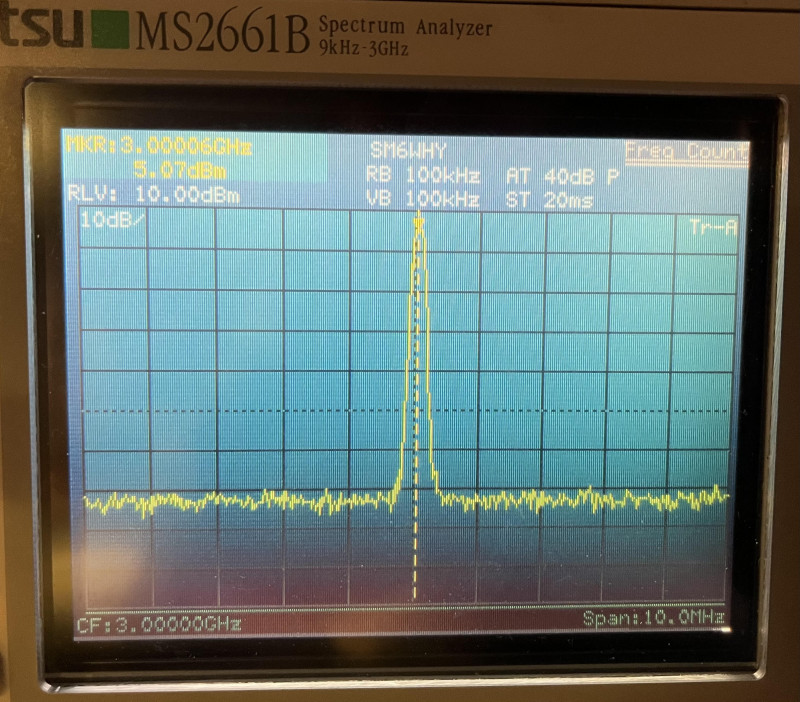
Uncertainties are always present. The gain measurement is crucial for these measurements. The absolute values might be less important, it is the relative measurement that matters. Even so, it is easy to compare the instruments against each other. About 5dBm 3GHz injected to 3 devices.
The SA: 5.07dBm
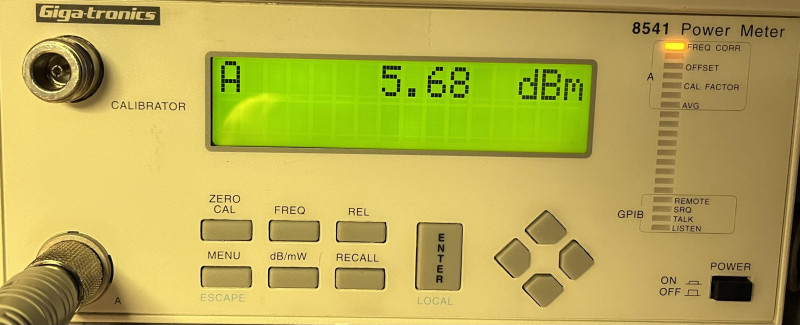
The Gigatronics 8541 with 80301A power sensor 5.68dBm:
And the "primary standard" HP 432A thermal sensor power meter 5dBm:
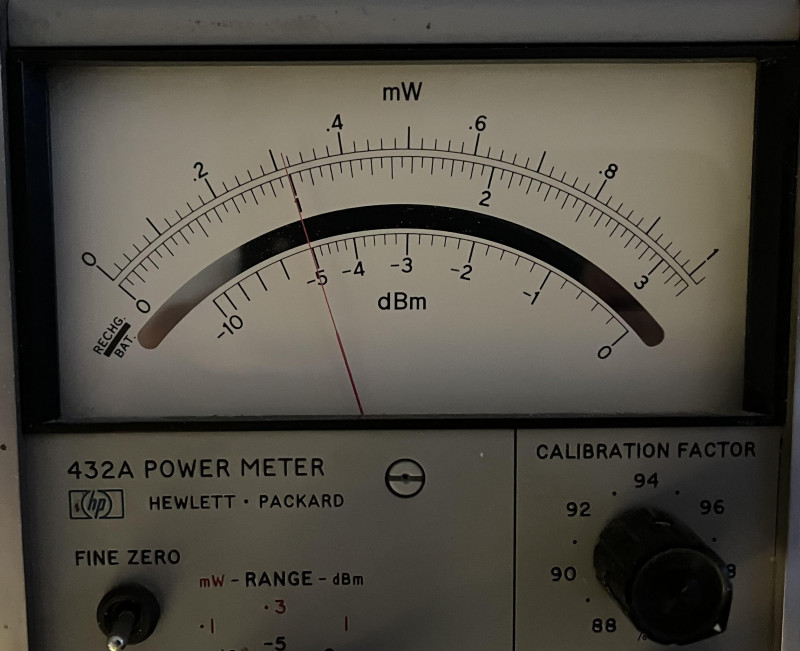
Yes the 432A is old, but still rocks. The HP and the Anritsu shows more or less the same.
Of course, will the power meters measure not only the fundamental frequency but also the harmonics from the ADF-5355 (54MHz => 13.6GHz) generated frequencies. How much they influence is not known by me. The Gigatronix measure a higher result, but which right? Lets move on.
Once more 432MHz, now span 100Khz to speed up the measuring time 1kHz RBW and 10Hz VBW.

Now 2.8dB using the gain method. I have ordered an calibrated noise source so it will be interesting to see what that measurement will reveal regarding NF for this little LNA.
Hopefully will this be a perfect companion in the shack to measure NF for pre-amps. This NS cannot be used measuring filters etc. with an SA without an external pre-amp. Why is that?
Why can ’t I see my noise source on a spectrum my analyzer?
Example:
To determine the dBm level that a 50-ohm noise source with a 15.5 dB ENR would read on a 50-ohm spectrum analyzer in a 1 Hz resolution bandwidth (RBW), follow these steps:
Understand the ENR Concept: The ENR (Excess Noise Ratio) of a noise source is defined as: ENR (dB) = Noise Source Power (dBm) − Thermal Noise Floor (dBm)
Calculate the Thermal Noise Floor:
For a 50-ohm system, the thermal noise floor in a 1 Hz bandwidth is approximately -174 dBm. This is calculated using the formula:
Thermal Noise Floor (dBm)=10⋅log10(k⋅T⋅B) +30 where k is Boltzmann's constant (1.38×10⁻²³ J/K1.38×10−23 J/K), T is the temperature in Kelvin (290 K), and B is the bandwidth (1 Hz).
Thermal Noise Floor =10⋅log10(1.38×10−23×290×1) +30
Thermal Noise Floor = 10⋅log10(4.002×10⁻²¹) +30 Thermal Noise Floor = −174 dBm
Determine the Noise Source Power Level:
Given the ENR is 15.5 dB; you can use this to find the noise source power:
Noise Source Power (dBm) = ENR+Thermal Noise.
Floor Noise Source Power (dBm)=15.5 dB+(−174 dBm)
Noise Source Power (dBm) =15.5−174 Noise Source Power (dBm) = −158.5 dBm
Therefore, the 50-ohm noise source with a 15.5 dB ENR would read -158.5 dBm on a 50-ohm spectrum analyzer in a 1 Hz RBW. Many SA has not this large dynamic range.
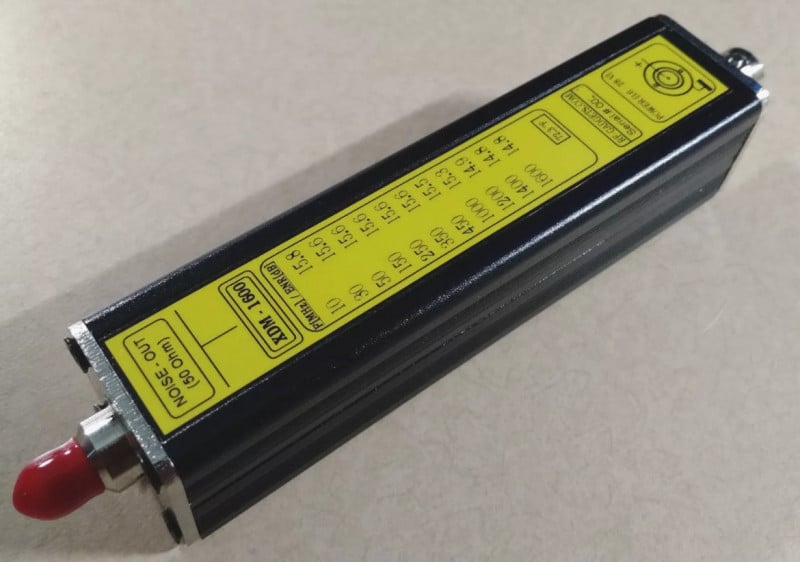
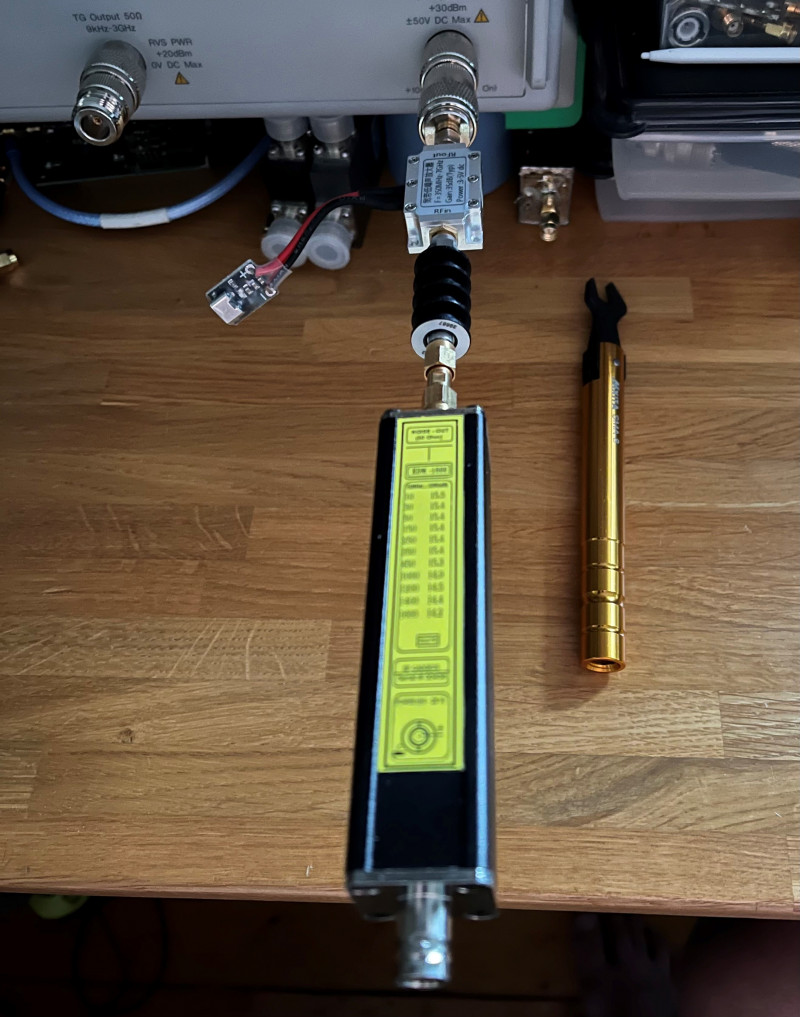
The noise source is rated to a noise level of about 15.5dB. Calibrated from 10MHz to 1.6GHz.
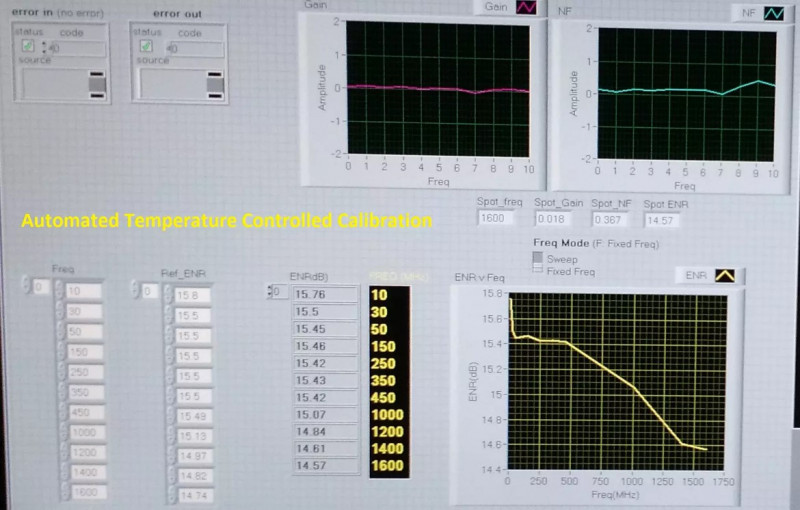
Measurement using the Y method gave other results. The noise source has an ENR of about 15 dB. This is a high value and most suited for LNA with high NF. Therefore, I mounted a high quality 10dB 18GHz attenuator between the noise source and the LNA input. 5dB is more suitable level for measuring low NF.
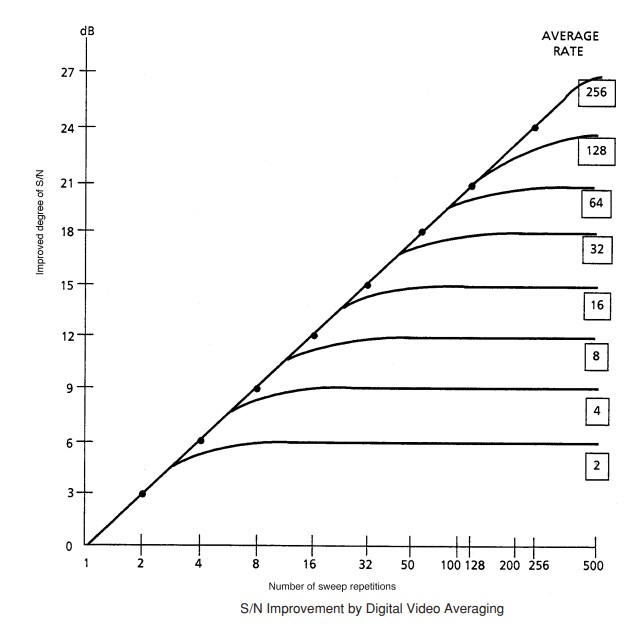
It is also very important to use enough averaging in the SA measurement. I tested some different settings, and 300 counts seems fine. The SA SNR improves a lot using this feature.
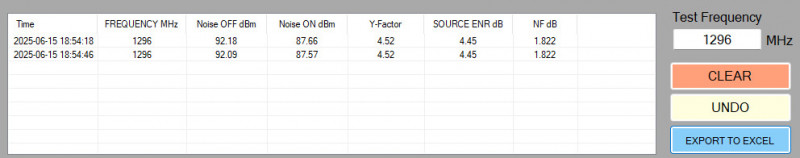
Using these settings the following results was measured (@1.6GHz):
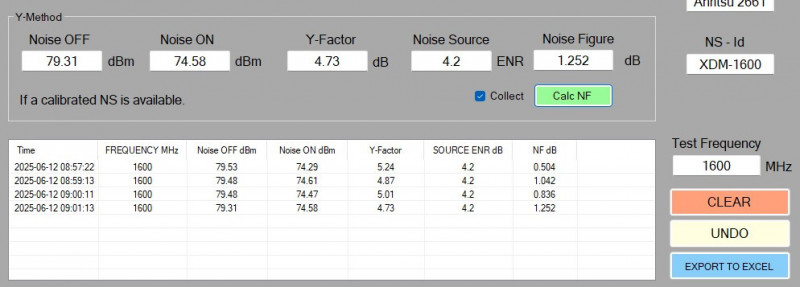
There are deviations, and maybe I need to adjust the averaging or SA RBW/VBW some. However, the average result of these measurements yields an NF of 0.91 for this LNA @ 1.6GHz. The NF seems to increase between the measurements and the reason could be that the temperature of the LNA increases. It is possible to feel the heat by touching the housing. The NS is calibrated @ 72.3F, 22.39ºC and that is very close to room temperature.
It might also be necessarily to add more shielding on cables etc.
My 23cm pre-amp I’m using is the MVV1296 VOX. It has a stated NF between 0.8 and 1.2dB. Since it was taken down for an overhaul, I made a test of that as well. The gain can be set inside and was measured to be 12.5dB, max gain is 22dB.
This measurement gave > 4dB NF. Uncertainties increase with lower gain; maybe will the NF decrease if the pre-amp gain is increased. And maybe is the stated NF measured at the maximum gain (22dB)?
I adjusted the gain to 17dB. According to the specification 22dB is maximum. However, I did not reach 22- and 22-dB gain is really not wanted living urban. I have 2.7dB loss in my 15m LMR-400, and from my opinion is the IC-9700 a bit deaf on 23cm already therefore some extra gain is necessarily.
At 12dB gain the NF I measured up was about 4dB, quite bad since the specification says 0.8 to 1.2.
Since many nearby stations is located close to my QTH I did lower the gain, and actually I noticed a clear difference in noise. First, I believed that “well, now everything generates noise” and did not think so much more about it. But, since I’m now able to perform noise measurements I started to test.
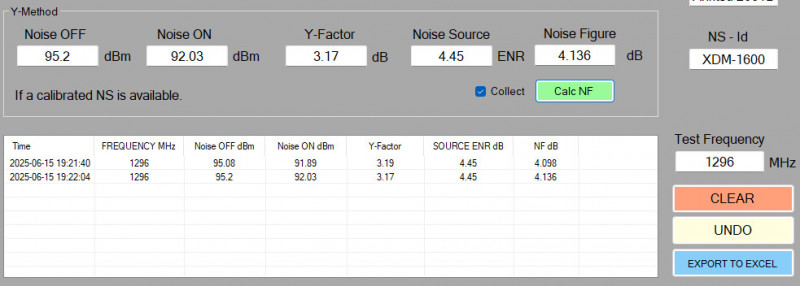
Ok, so what happens to the NF after the gain is adjusted? 2 Measurements after everything is heated up and running.
If 5dB more gain reduce the NF with about 2.5dB then maybe 5 more dB reduces the NF to the specification 0.8-1.2.
End line, I have learned that measuring tells it all. (I did know that before) specifications is only true at the exact same conditions as it was measured.
BUT,
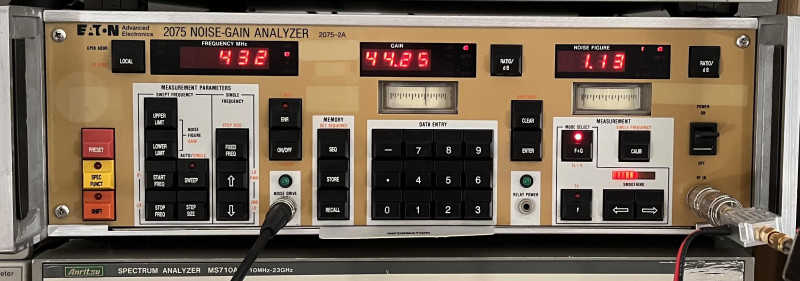
I came across an EATON 2075 noise figure meter. It has a longer warm-up time compared to the HP-8970. But it seems to work pretty well. I did measure the NF @ 432 again for the Chinese LNA.
NF 1.13 and gain 44.25dB.
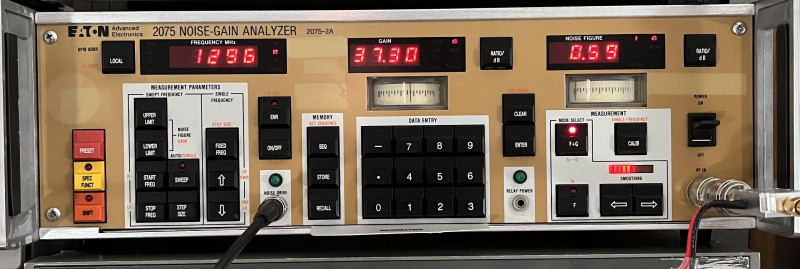
And 1296, NF 0.59 and 37.3dB gain.
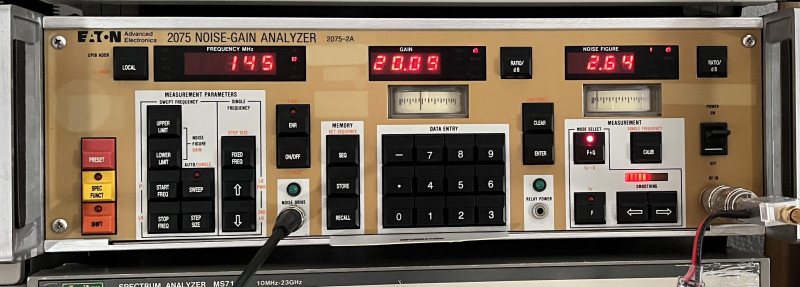
The LNA is rated from 350MHz. The performance @ 145MHz drops.
Welcome
Welcome to sm6why.n.nu.

My Newsletter
Links